

"The United States can pay any debt it has because we can always print money to do that. So there is zero probability of default"
US politicians listened intently to that sentiment and followed Greenspan’s lead with US government debt increasing from $14.5 trillion in 2011 to over $33trillion today. Furthermore, US government debt has tripled since the 2008 Global Financial Crisis (GFC) -see figure 1, page 2.
One of the key problems for the US is that national debt, either in aggregate terms or as a percentage of GDP, has continued to grow despite the economy recovering from these economic crises. Debt is now driving US economic growth and without government deficits would be in a deep recession. Metaphorically speaking, like a patient overcompensating with pain medication, the US has found themselves addicted to debt.
Can this spending continue? And if so, what are the consequences?
In this paper I highlight:
- US politicians have little incentive in the near-term to change their spending habits,
- The cost of funding this spending has increased dramatically due to higher interest rates meaning debts are expected to continue rising, and
- The US economy will continue becoming organically weaker in the face of higher interest rates.
From my perspective:
- The US dollar must weaken unless other governments follow suit,
US interest rates are unsustainably high given the rising debt servicing burden, and - US assets are expected to underperform in this environment.
Given these dynamics and current valuations, we expect US equities to underperform in the years ahead despite the exceptional quality of certain companies, particularly in the technology sector.
The next 10 years
According to the Congressional Budget Office (CBO) ,annual government budget deficits will average $1.2 trillion a year from 2022 to 2031 and exceed their 50-year average of 3.3% of GDP in each of those years. This will see the US government’s debt balloon over the next 3 decades, with the CBO’s recent baseline projection for the US federal debt reaching 181% of GDP in 2053. Further, they also state that federal debt could reach as high as 250% of GDP if the impact of rising interest rates on private sector investment is worse than they expected.
If this forecast proves true, US debt will grow to $50 trillion in the next decade. This is an unprecedented amount of debt to finance annually, from both a monetary and a demand perspective.
“The United States government...is going to have to sell$2 trillion (net) of new bonds next year and roll overanother $5 trillion. Central banks and governments areselling more bonds than they've ever sold before.”
Figure 1: Total US Debt Outstanding ($USD millions)
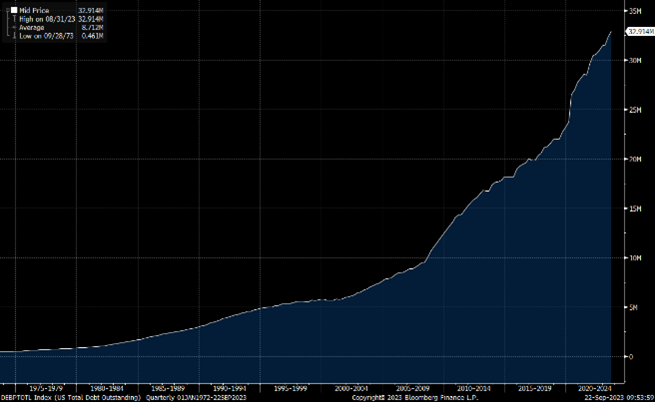
Source: Bloomberg
Figure 1 shows that US debt has risen considerable in response to both the GFC (2008/9) and the COVID-19 pandemic (2019), however the trend was established well before these two events, accelerating rapidly since the end of the 1980’s.
Figure 2: US Budget Deficits (as a % of GDP)
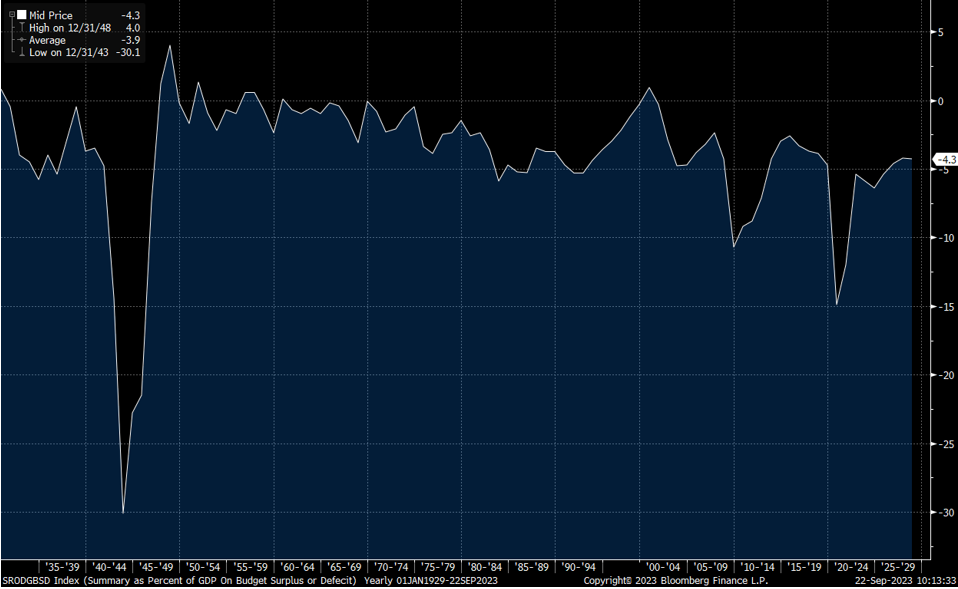
Source: Bloomberg
Figure 2 shows that historically after large budget deficits, such as World War 2, where governments tried to rebalance the budget. This clearly changed in the 1980’s when annual deficits of -2.5% to-5% became a common occurrence.
This increasingly risky debt profile could change if politicians adopted a bipartisan agreement to reduce spending and accept weaker economic growth -however, this is unlikely for three key reasons:
- Recent polling suggests the next president is likely to be either former President Donald Trump or President Joe Biden, whose successive terms have had record expenditure,
- Making significant changes to the budgetary spend would require either cuts to military or social security and neither are likely in the current environment, (see figure 2),
- It appears as though the US believes it can continue printing money as the US dollar is the reserve currency – and there are currently no alternatives.
It's all fine until...
“We are at the beginning of a late, big-cycle debt crisis when you are producing too much debt and have a shortage of buyers.”
The lack of appreciation for the negative consequences of the US government’s fiscal and debt issues is astounding, especially among professional investors. This underestimation of the long-term consequences of the US’s predicament mirrors similar situations in the past – in hindsight, all appeared obvious. At present, there some peripheral concerns about the Us’s economic sustainability from those paying close attention, but investors appear overly complacent. This is likely because the economy performs well due to the injection of debt, which hides major problems.
The economy performs well because the debt repayments pump more money back into the economy in the form of income and coupons received by debtholders. The counterbalance though, is that this spending also supports prices and hence inflation, which in turn places additional pressure on interest rates. This is exactly what we are seeing now with the US economy growing by 4.9% annualised in Q3 2023and inflation remaining stickier than expected.
Given a 40-year rally in US equities and bond markets since 1981, this complacency may stem from the significant influence US hegemony has had on the world well since the end of World War 2. Hegemonies have waxed and waned throughout history and this credit/debt crisis may one day be referred to as foreshadowing the end of this current era.
The recent bout of global inflation, causing interest rate tightening by global central banks, in addition to the rising strength of the BRICS+ alliance, are potential catalysts that may challenge this US dominance. Said bout of higher inflation was largely caused by supply-chain issues resulting from Covid-19 global shutdown. Although it was erroneously thought to be transitory, inflation has remained stubbornly above central bank targets despite the supply chain issues being largely resolved.
The key issue for the US is that higher inflation has driven up interest rates and thus the total funding costs of its government debt, which raises an important question; Can the US continue to finance its $33 trillion of debt following the removal of near-zero rates that dominated the 2010’s?
This is the Titanic of debt spirals with the Iceberg inplain sight.
Debt spirals eventually become unsustainable unless governments can inflate their way out or are willing to make harsh fiscal cuts and accept a recession. Neither solution seems viable in the current environment and as previously discussed, we do not think the US Congress is willing to make the necessary tough decisions to reduce healthcare, social security and defense spending. The latter is becoming increasingly important given the ongoing conflict in Ukraine, resurgent violence in the Middle East and the US’ commitment to Israel.
The unwillingness of governments to cut spending during expansionary times also makes it unlikely that they will make the hard decision as their economy slows, which the US economy is set for in 2024. Especially given that a slower economy exacerbates the problem given a decline in tax receipts and increased socially security payments only increases the likelihood of a debt spiral continuing.
Where are the buyers?
Increasing debt issuance requires buyers, and it is for this reason that the growth of the BRICS alliance is of paramount importance. Of the ~$33 trillion of outstanding US debt, ~$6.8 trillion is held as intragovernmental holdings and ~$26.2 trillion is held by the public.
According to the US Treasury’s September 2023 Bulletin, Foreign and international holders accounted for $7.7 trillion of Treasuries in July 2023.Japan (US$1.1 trillion) and China (US$860 billion) are the two largest foreign holders of US Treasuries, while other BRICS nations like India (US$235bn) and Brazil (US$225bn) also have substantial holdings – see figure 3 for largest holders of US treasury securities by type. The sale of US Treasuries by BRICS nations is increasing, both as a tool to defend their domestic currency values from recent devaluations verses the US dollar (and reductions in US Dollar reserve requirements) as BRICS+ nations shift to using their own domestic currencies for international trade.
China have reduced their holdings of Treasuries by~25% since 2018. This trend is expected to continue as China sells less to the US due to growing geopolitical divergence shifting its economic partnerships towards BRICS+ affiliated countries. With China and fellow BRICS+ moving away from being major holders of Treasuries whilst interest rates and energy costs are driven higher, as we approach 2024 US economic sustainability is by no means guaranteed.
Many countries have become cautious of holding US assets given that the US-led sanctions regime froze~US$300 billion of Russian offshore assets in 2022 following its invasion of Ukraine.
Figure 3: US Treasury Securities Holders by Type
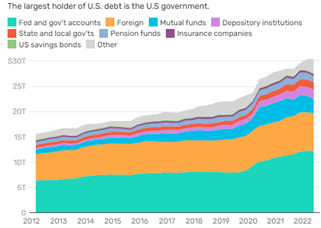
Source: US Treasury Department, The Balance (thebalancemoney.com)
Given worsening Sino-American relations and heightened tensions in the South China Sea, that questions are being raised as to the nature of President Xi Jinping’s “reunification” with Taiwan is of no surprise. As Taiwanese sentiment undermines any notion of a voluntary amalgamation, should China pursue a more aggressive strategy, there is little doubt that a similarly punitive sanctions regime would be enacted. Future predictions aside, the scale of the post-Ukraine sanctions regime may have spooked Beijing and represent risk it no longer needs or wants to take.
Crude oil prices have increased by ~25% since July 1st, 2023, principally due to a combination of reduced supply from the US Strategic Oil Reserve, substantial supply cutbacks from leading oil production nations (e.g. Saudi Arabia, Russia) through OPEC+, and the Israel/Hamas conflict. OPEC is forecasting the supply shortfall will exceed 3 million barrels/day in Q4 2023, raising the prospect of oil prices surpassing$100/barrel sometime in Q4 this year.
In February 2023, Russian President Vladimir Putin unveiled new Russian oil and gas deals with China worth an estimated $118 billion, promising to ramp up Russia’s Far East exports. Should this come to fruition, we could see a future where Western nations pay more for oil that OPEC+ allies.
In September 2023, Bloomberg reported that Russia expects to sell its pipeline natural gas to China at a 43% discount to European contract prices in the next three years ($271 per 1,000 cubic meters next year compared with an average of $482 for clients in Europe). Ceteris paribus, the ensuing higher energy prices for the US means continued price pressure on sticky inflation and a headwind for consumption and hence economic growth – all while debt is increasing and being financed at increasingly higher rates. US 10-yearbond rate yields touched 5.00% on 19 October 2023, their highest level since September 2008, while 2-year Treasuries are currently yielding of 5.05%.
Impact for investors
As Greenspan said, the US cannot default on its debt unless it chooses to. However, its lack of prudence and restraint may have major ramifications.
Firstly, buyers of US debt are likely to increasingly demand higher interest rates for continuing to finance record US government deficits, especially if inflation remains stubbornly high. However, these higher rates accelerate its unsustainable debt spiral. One of the few plausible ways out of this could be a restart of Quantitative Easing (QE), whereby the US Federal Reserve resumes buying outstanding US government debt and effectively capping interest rates at favorable levels.
Japan effectively took this path in the 1990’s when it began implementing policies of near-zero interest rates. Its journey started in the mid-1980s and included:
- Low borrowing rates of between 5% in 1985 to 2.5% in 1987.
- Large-scale borrowing that Japanese investors used to buy assets,
- Asset prices climbed due to artificially low interest rates creating an economic bubble, with Japan’s Nikkei 225 index up 240% from 1985 to 1989.
- This asset bubble eventually burst in 1990, following a shift in the Bank of Japan’s monetary policy that tightened interest rates from 2.5% in 1988 to 6% in 1990.
- Economic growth fell towards 0% for much of the 1990’s, forcing the Bank of Japan to commence QE and lower interest rates between 2% and –0.3%over the period from 1995 to 2023.
- This resulted in the BOJ’s balance sheet reaching 260% of GDP in 2022, due to anemic economic growth and large government deficits.
This led to three lost decades for the Japanese economy. The beginning of this crisis bears notable resemblance to the current situation in the US which appears to be on the precipice of a similar economic fate to Japan.
Some financial commentators believe the US should learn from Japan’s fate and avoid a severe collapse in its financial asset markets by initiating QE through yield curve control immediately. However, given concerns over existing large US debt balances and stubborn inflation, it is likely the US Federal Reserve will need to see clear evidence of a recession before it restarts QE.
Secondly, if this is the case and the US follows the path of Japan into a prolonged return of QE policies, itis highly likely the US dollar will weaken significantly against other major currencies. Even without QE, the increased supply of US dollars from rising US deficits coupled with continued foreign selling of US-Dollar assets should also see its value decline over the medium term. This is likely to benefit US companies that export goods and services but be negative for global investors (including Australians) holding US dollar denominated assets.
As of 2022, non-US citizens held US$25trillion of US long-term assets, split equally between fixed income and equities. With the US Nasdaq and SP500 index trading at a 50-70% premium to other global markets the US could be considered one of the most overbought equity markets in the world. A pre-emptive capital withdrawal could lead to some substantial losses for investors over-exposed to the rising risk profile of US financial markets.
Lastly, hard assets like commodities or Tier-1 infrastructure assets (including property) that have tangible utility are likely to see additional demand in this environment. This is due to 3 main factors:
- Developing world continuing to grow – e.g. India and Indonesia,
- Evolution of new technologies and sectors – e.g. Automation and Clean Energy, and
- Countries seeking access to restricted commodities essential for technological growth, e.g. Graphite.
Commodities that are likely facing a large imbalance between demand and supply (including oil, copper, rare earth minerals, graphite and lithium) may offer better long-term investment fundamentals than US equities in the environment outlined above.
Gold could also do well in this environment given its historical role as a currency (or currency base) and store of value. It also has a potential new price driver – as BRICS+ nations look towards a non-US dollar global currency regime; they may look to partly peg its value to gold.
Though gold has historically been negatively correlated with real interest rates, this appears to have decoupled from past trends since Q2 2022. The shift to higher rates in the US (from 0.25% in March 2022 to 5.5%in July 2023) saw just a 3% fall in the US$ gold price over this period. Against the Australian Dollar, gold is up ~9.5% since March 2022.
Conclusion
As examined, there are several serious issues with the current state of the US’ financial position that may have significant impact on markets. The US has been at the forefront of financial markets for over a century and is largely assumed to have served investors well across the globe. Additionally, its manufacturing and technology capabilities have transformed society through innovations including the motor car, railway, computers, the internet, and artificial intelligence (AI).
However, 5 decades of US economic mismanagement have led to major debt issues that look set to worsen in the years ahead. The US is likely to have been lucrative for investors over recent years, especially if they held the ‘magnificent seven’ tech stocks in their portfolio. However, may also mean that investors are now overweight US equities into a potentially difficult environment.
The focus on the US has seen investors ignore investment opportunities in other global markets, and we think this represents an excellent investment opportunity – especially in Asia. Faster economic growth forecasts, better demographics, stronger balance sheets and attractive asset market valuations make them fertile grounds for investors – particularly equities. Looking beyond the US, we are excited by the opportunity set developing in commodities, Asian and European equities, and investment themes like the electrification of transport, innovative technology, and healthcare.
As Bob Dylan’s classic song said:
“The Times They Are A Changin”
– and this is certainly true now from an economic and investment standpoint.
We think the US is approaching a pivotal point in its history, which is likely to have significant implications for investors. We also think it can deliver exceptional opportunities for investors if they embrace the change and able to invest with a flexible mandate and open mind. If you would like to explore the current environment in more detail, understand our current investment theses and/or Carrara’s investment offerings please feel free to contact us.
Citations
- CBO is an independent and nonpartisan organisation providing analyses of budgetary and economic issues to support the Congressional budget process since 1975.
- CBO, “The Budget and the Economic Outlook: 2021 to 2031
- CBO, “The Long-Term Budget Outlook Under Alternative Scenarios for the Economy and the Budget”, July 2023
- US Treasury (fiscaldata.treasury.gov as at 20/9/23)